Analyze statistics using tags
If you tag everything you handle in Kundo, you can see very interesting things in Kundo's statistics tool. You can, among other things:
- Get a quick overview of the type of cases you handle in Kundo and what they are about.
- Make more in-depth analyzes of which cases you handle.
- See how the inflow of a certain type of case changes over time and in this way be able to measure the effect of different measures.
In this guide, we show you how to do this by using a sample company.
Example - the training company
The training company has three training facilities and a central customer service. They want to keep track of the type of cases that come in, what the cases are about and which training facility may be affected.
The training facility uses three different types of tags.
Type of case (Typ av ärende):
- Question (Fråga)
- Suggestions (Förslag)
- Complaint (Klagomål)
Each case must be tagged with one of these tags.
Subject (Ämne):
- Payment (Betalning)
- Reservation (Bokning)
- Membership (Medlemskap)
- Pass (Pass)
- Trainer (Tränare)
- Training (Träning)
Each case must be tagged with one of these tags if appropriate. If the case is about something else, a new tag can be created for everyone to use.
Facility (Anläggning):
- Centre gym (Centrumgymmet)
- Little gym (Lilla gymmet)
- Great gym (Stora gymmet)
Each case must be tagged with one of these tags if any of the gyms are affected.
Each case will have at least two, sometimes three tags.
Get a quick overview of cases in Kundo
In the All tags list, you see how many cases have been received during the selected period and have been tagged with a certain tag.
It is easy to see the distribution between a selection of tags by creating a group in the tag statistics. In this way, you can get a quick overview of, for example, the type of cases you handle.
Anyone can create a group and it will then be visible to all editors on the Tags page in the statistics.
Example - the training company
The training company has created three different roof groups; Type (Typ), Subject (Ämne) and Facility (Anläggning).

In the Type (Typ) group, they can easily see that almost half of all cases are questions (Fråga), but also that they have quite a lot of complaints (Klagomål).
The percentage indicates the percentage of conversations that have one of the tags in the group that has a particular tag. In the example above, 47% are questions (Fråga), of all conversations tagged with either Question (Fråga), Complaint (Klagomål) or Suggestion (Förslag).
Some conversations can be about more than one issue and therefore can been tagged with multiple tags within the group, therefore the percentage may be more than 100%.
In the example in the image above, some conversations have been tagged with more than one of the tags Question (Fråga), Complaints (Klagomål) and Suggestions (Förslag) and therefore the sum of the percentages is 107%.
Example:
A tag group is used to see the distribution of cases between different facilities, and 10 cases have been received. 5 cases concern facility A, 4 cases concern facility B and 1 case concerns both facilities (ie have been tagged with both tags). The statistics will then show:
Facility A 60% (6 conversations)
Facility B 50% (5 conversations)
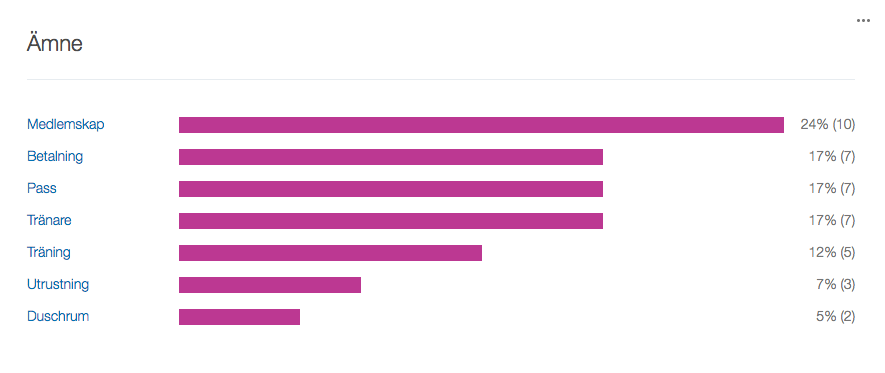
In the Subject (Ämne) group, they get a quick overview of what the cases are about.
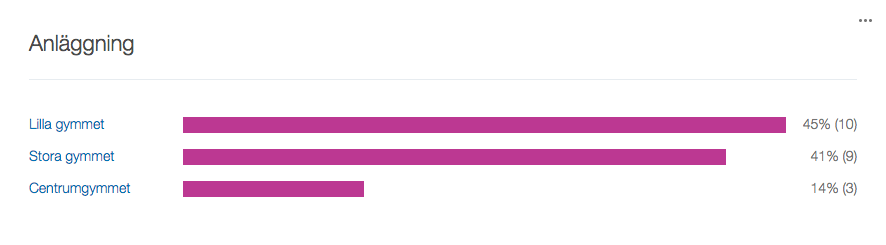
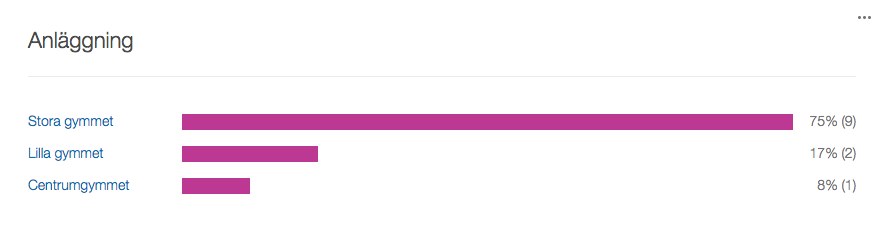
Finally, they create the Facility (Anläggning) group to see the distribution between cases that have to do with a specific facility. Despite its size, the small gym (Lilla gymmet) generates almost half of all matters that have to do with a facility.
Analyze more - filter on tags
To be able to find out what the cases are actually about, it is possible to filter the tag statistics on one or more tags.
Here, the tag statistics are filtered on the Complaints (Klagomål) tag. Then you can see which tags have been used in combination with the Complaints (Klagomål) tag.
Example - the training company
Since many of the issues seem to be questions, the person in charge of the customer service filters the tag statistics on the Question (Fråga) tag to better understand what the customers are asking about.
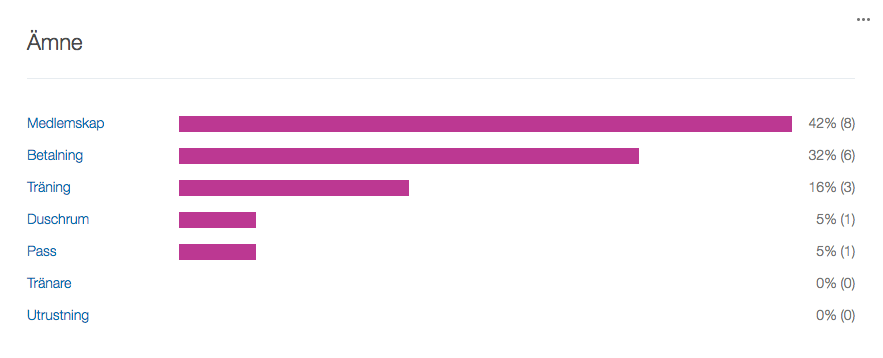
In the Subject (Ämne) group, you can see that the majority of the questions are about Membership (Medlemskap) and Payment (Betalning).
The person responsible for customer service is also curious to better understand what the fairly large number of complaints (Klagomål) is about and filters the tag statistics on the Complaints tag.
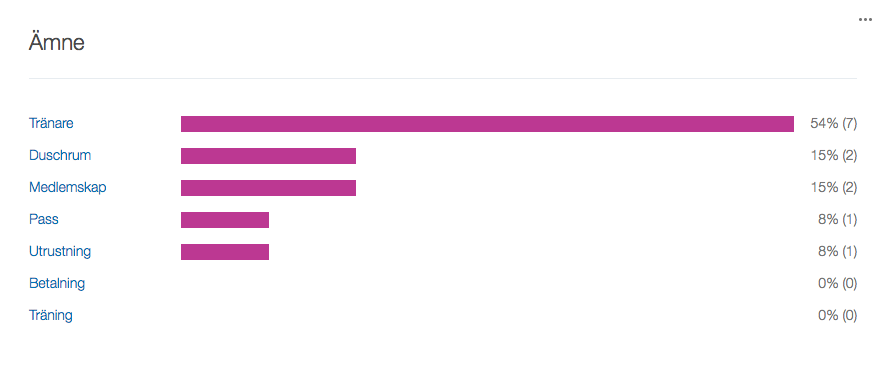
In the groups Subject and Facility, a clear picture emerges that the majority of the complaints are about Trainers (Tränare) or the Great gym (Stora gymmet).
The customer service manager then filters the statistics on both the Trainers (Tränare) and Complaints (Klagomål) tags.
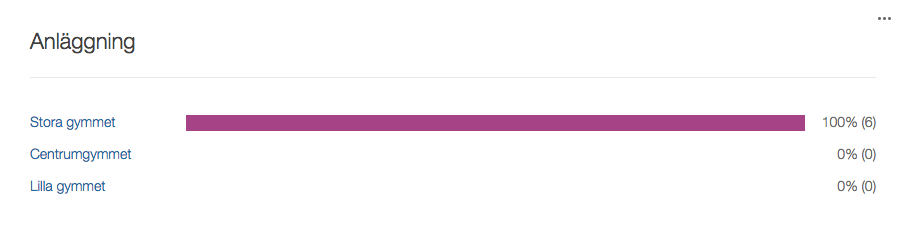
It then appears that all complaints that have to do with trainers have also been tagged with Big gym (Stora gymmet) and that no complaints about coaches have been received about the other facilities.
By clicking on the name of the tag, the customer service manager comes to a filtered list of cases that have that tag. After looking at some cases, the customer service manager sees that it is one and the same trainer who repeatedly is mentioned in the complaints and contacts the site manager for the gym to let them know.
See change over time
It is also possible to see how the inflow of cases of a certain type changes over time. In this way, it is possible to see if there are any upward / downward trends, if there are peaks for when a certain type of case comes in, or if a measure to reduce a certain type of case has had the desired effect.
Example - the training company
On the Conversations page in the statistics, there is, among other things, a graph with the number of new cases received during the selected period.
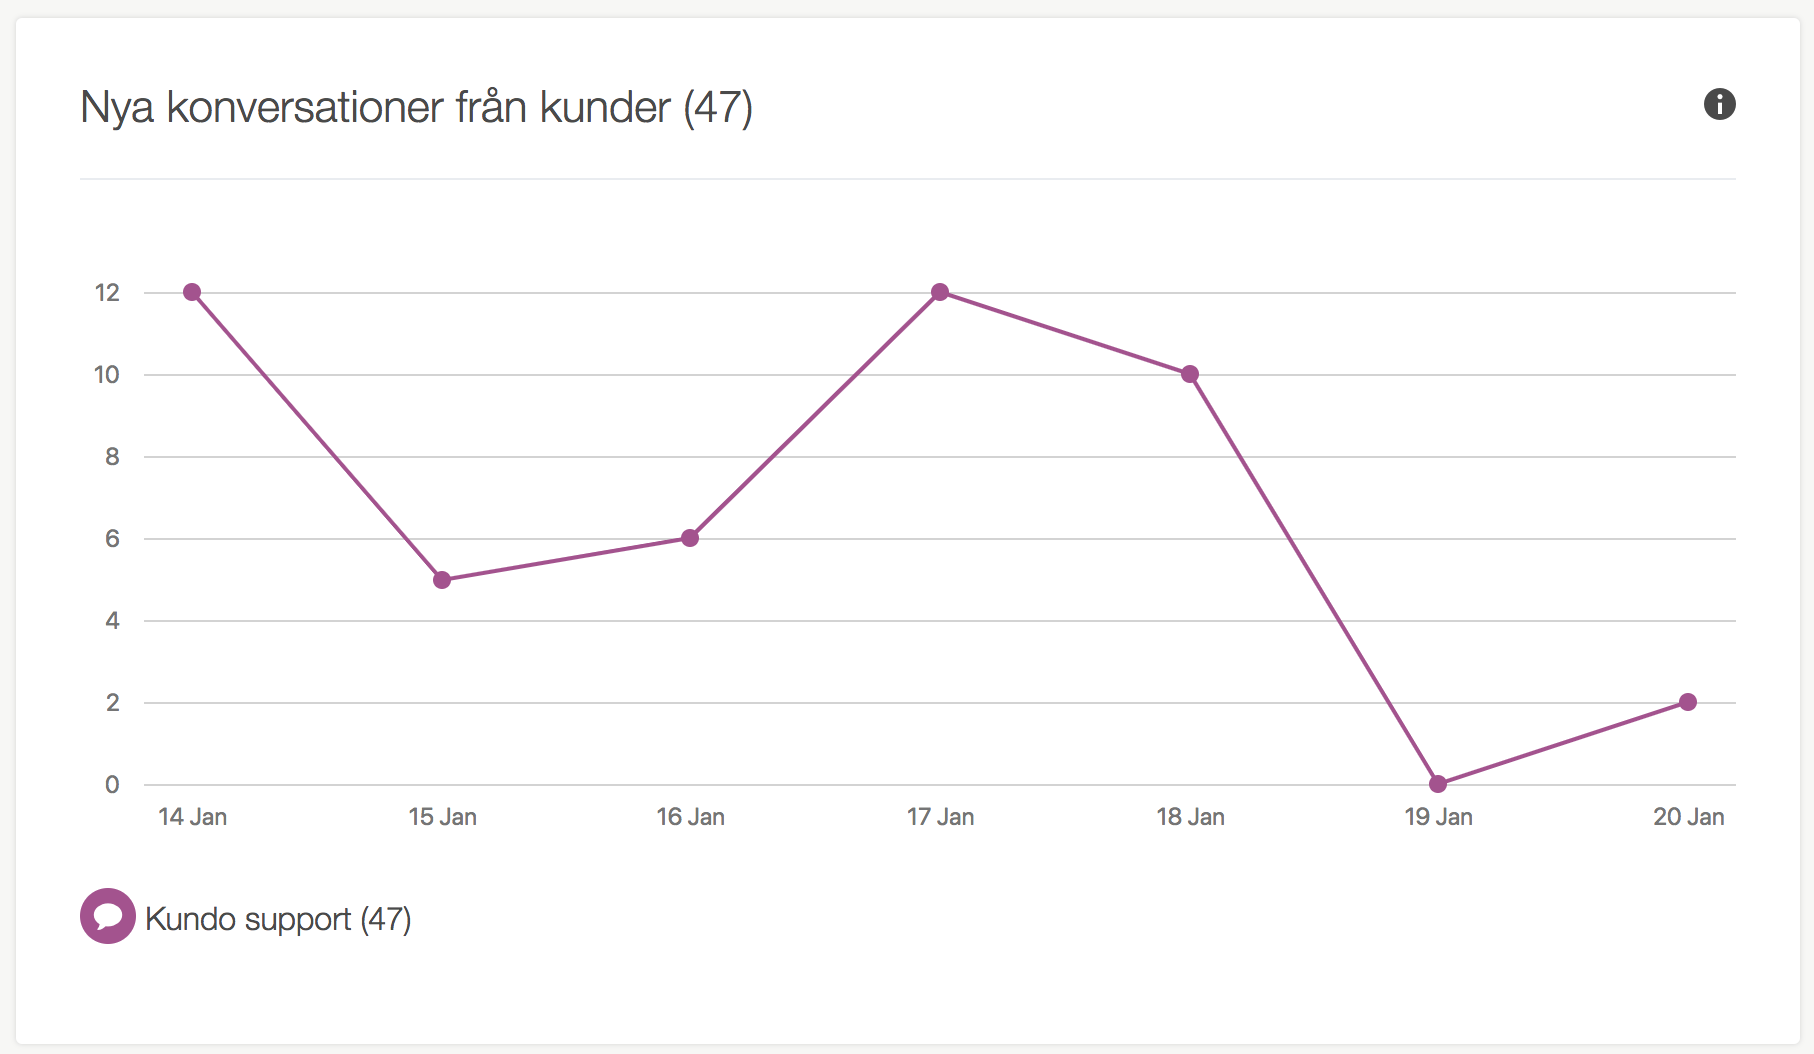
This page can also be filtered on tags.
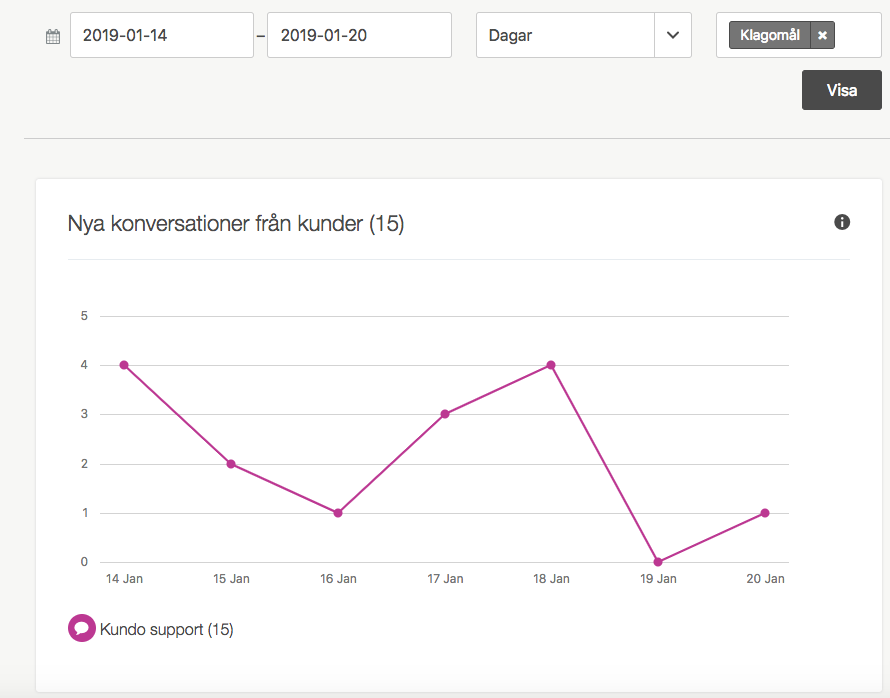
Here, the same graph is filtered on the Complaints (Klagomål) tag.
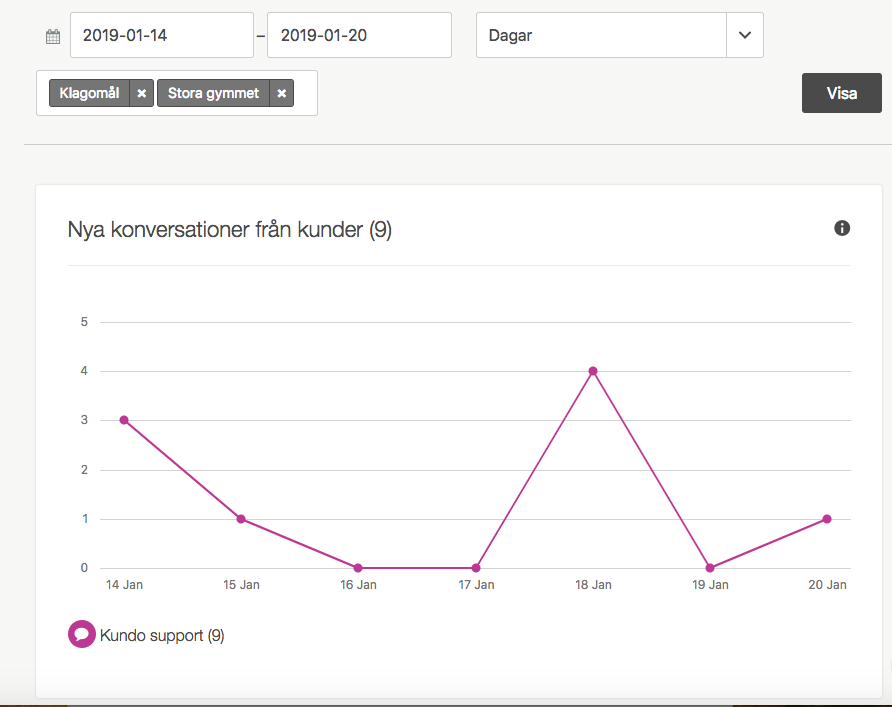
And here the same graph is filtered on the tag Complaint (Klagomål) and Big gym (Stora gymmet). With this filtering, it is easy to follow up if the number of complaints at the big gym decreases, for example after the place responsible tackled the problem with the trainer that many complained about.
Other statistics
Almost all statistics can be filtered on tags and it provides endless analysis possibilities. For example, it is possible to get answers to questions such as:
- How does the response time differ between different types of cases?
- What is the distribution over the day for different types of cases?
- Are certain types of cases more common during certain time periods (eg certain days of the week or specific dates)?